Understanding PHP Performance Measures
Welcome to the final installment of our series, where we delve into the world of XHProf measurements and discover the power of XHGUI in comprehending these values. In this article, we will explore the intricacies of the metrics obtained from XHProf and uncover how leveraging XHGUI can enhance our understanding of code performance and gain deeper insights into our codebase.
XHGUI User Interface
At the end of our previous post, we made two profile calls to an update workflow task in coreBOS and could see them in the "Recent" tab of XHGUI.
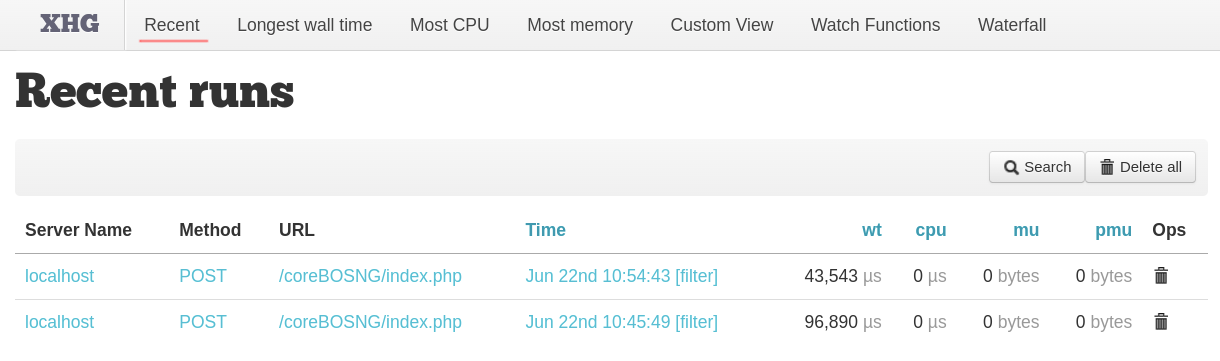
The view shows the server name the profile was executed in, the call method used, the URL, the time, and the measurements:
URL The URL of the request
Time When the request was made
wt or "Wall Time". This is the amount of time that passed during the request. It’s short for "wall clock" time, meaning the amount of time a human has to wait for the process to finish
cpu The CPU time spent on this request
mu Memory used for this request
pmu The peak memory usage at any point during this request
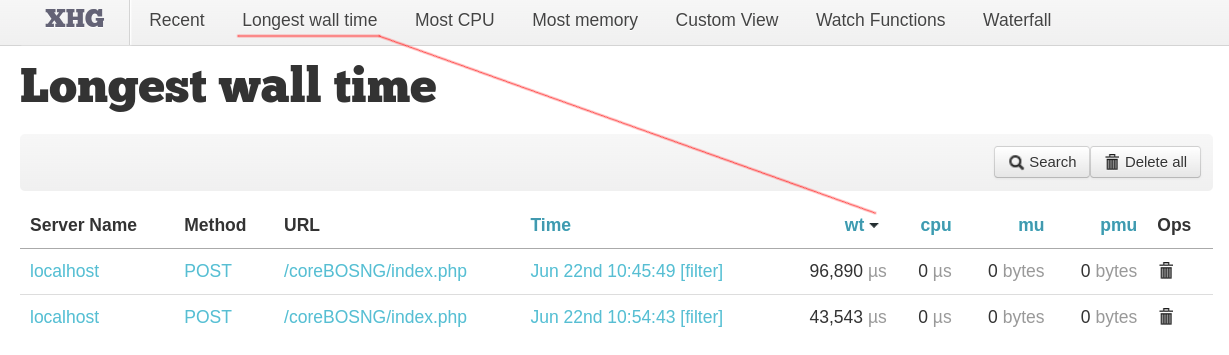
We can sort ascending and descending by most of those columns and the next three entries in the top menu actually only do that; sort by one of the columns:
The "Custom View" tab permits us to launch some condition-based queries to get a set of raw data out of the performance measures saved in the database. I don't see the use case of this information.
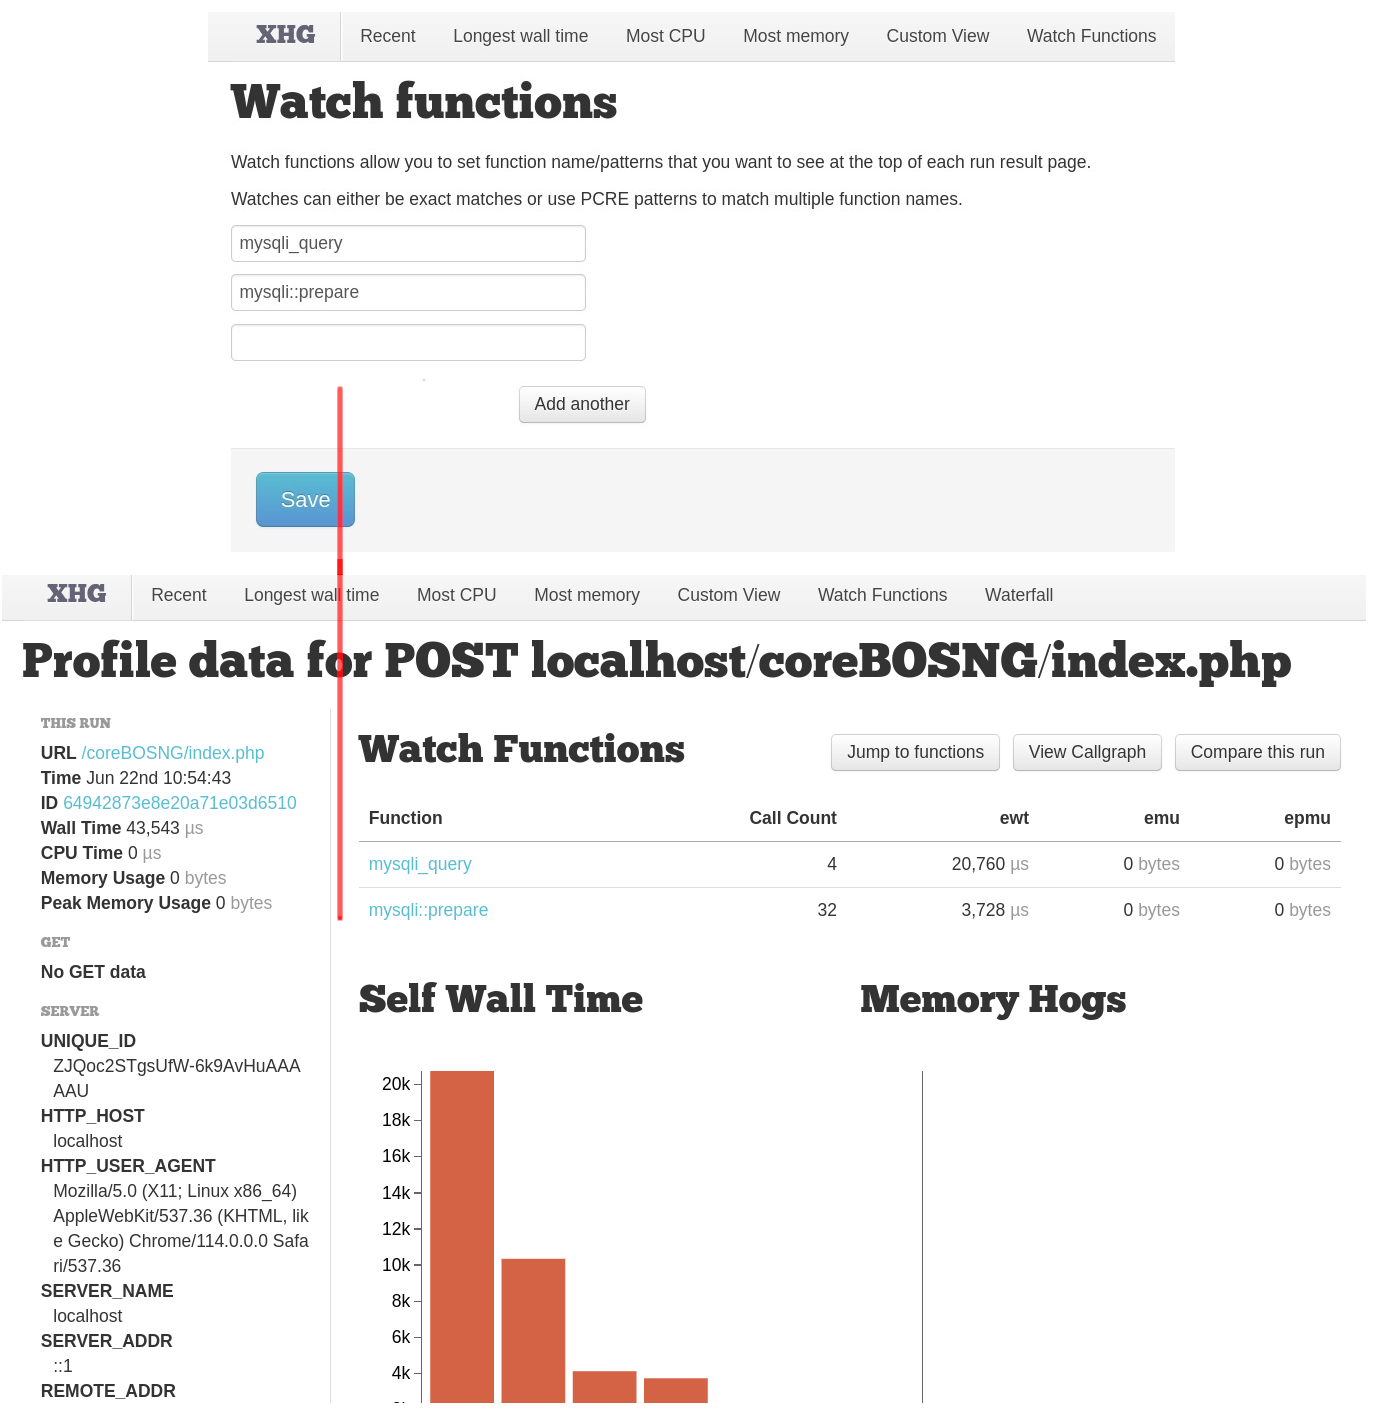
"Watch functions" allow us to set function names or regular expression patterns that we want to see at the top of each run result page. It simply shows the information on those functions at the top of the call result page. Nothing really important but a nice way to visually separate some functions from the rest if necessary.
"Waterfall" deserves a section of its own, so let's leave that for later.
To get more details about a specific "run", the term used to refer to generating a response, click on the date column for the URL you are interested in. You can also click on the URL to see a list of runs and choose between them by clicking on their dates. Either way, you’ll then see a more detailed view of just this one request with a lot of information about the call.
The top part of the screen shows the URL of the run.
The left-hand sidebar shows full details of the call and its parameters.
The main part of the screen shows some data about the top time-takers and memory-hoggers from all the various functions that got called during the run. There’s a detailed key below the graphs showing which bar relates to what.
On top of the graphs, we will see information on watched functions if there are any.
Below, we have a sorted table with all the functions called and detailed information about each one.
This table shows more detailed statistics for each of the component parts of the request. We see how many times each one was called as well as the time, CPU, and memory statistics for each function executed. Both inclusive and exclusive metrics are shown; the exclusive number gives the values for just this function whereas the inclusive values are for this function and any functions that are called from inside it. We can sort by the different values, we can filter functions and we can also click on the name of any function to get more details about that particular execution.
Another informative (and visually appealing) feature of XHGui is the Callgraph, it shows you where the time goes in a lovely visual fashion:
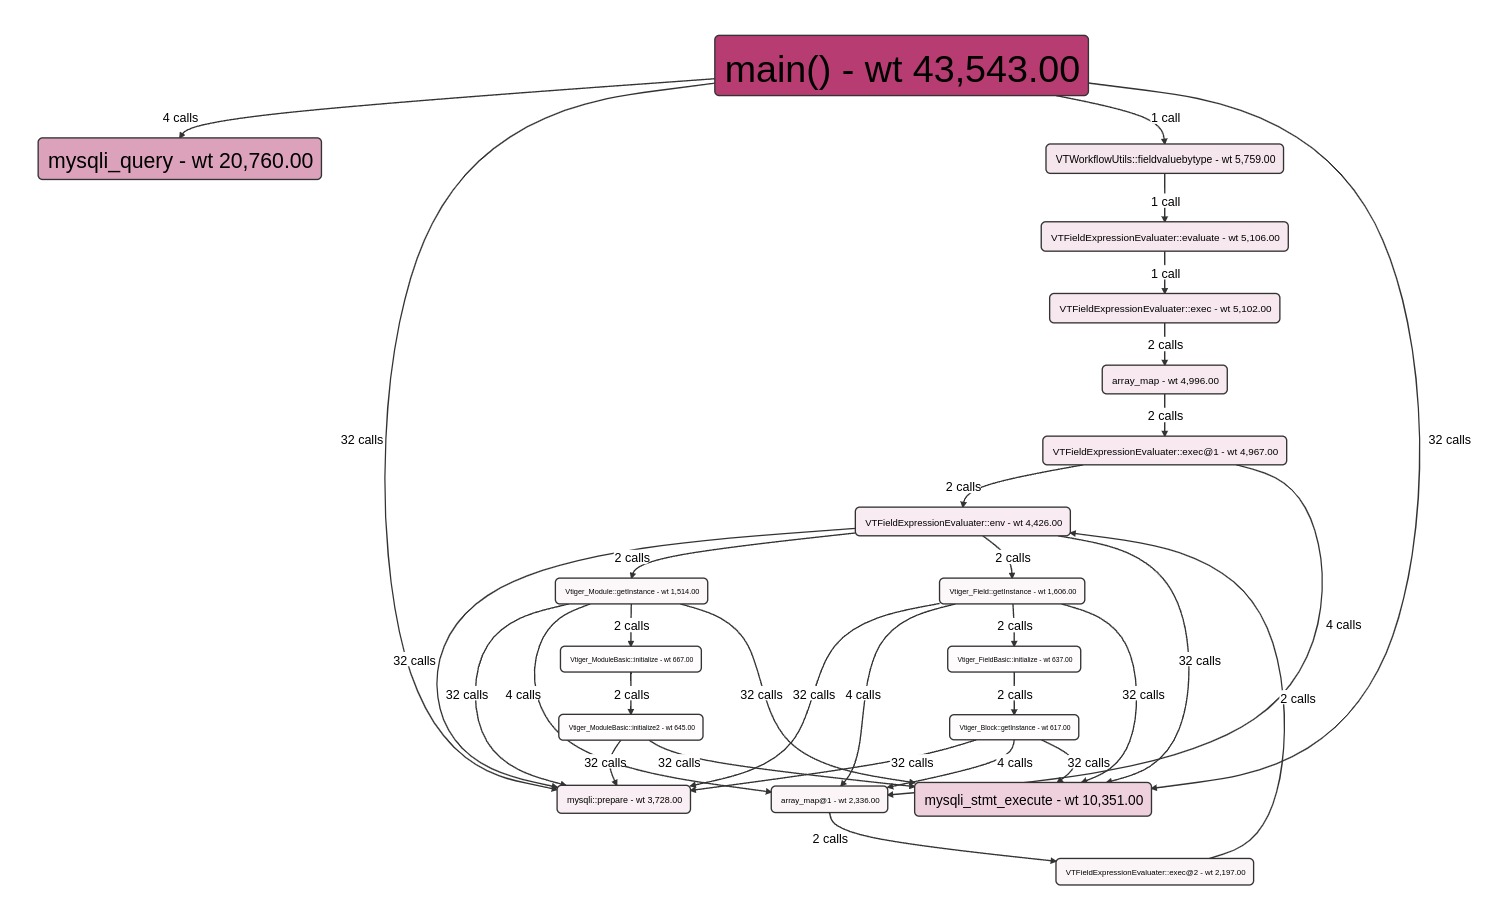
This shows a very nice visual hierarchy of which function calls which other function and the consumption of each function by color and size. Best of all, it’s an interactive graph, you can get more information about each function by hovering over it, click on the "view symbol" link to see the details of the function call and also click on the box itself to see a highlight of the path of the calls and a left menu with the details.

Really nice!
Comparing runs
Now we have all the information we need to optimize the code under analysis. By studying the different functions and time consumed we can set out to optimize the code and make it faster. Try to sort the functions by exclusive CPU (descending), or by memory usage, or exclusive wall time, and have a look at what lies at the top of the list. Analyze the expensive functions and try to refactor or optimize them. Also, don’t forget to check the call count; a function that is run repeatedly will deliver improvements several times over when optimized.
In order to know if we are making it faster or not we would need to be able to compare the execution before and after the optimization, and that is exactly what the "Compare Runs" functionality does for us.
Once in a run, we will find the "Compare this run" button in the upper right corner. That will permit us to select another run and retrieve a detailed output of the differences between the two executions. The summary table shows us the old and new metrics, and also the difference in both actual numbers and percentage change. The details table then gives the change in value for all the functions. You can sort by any of the columns to find the information you are looking for.
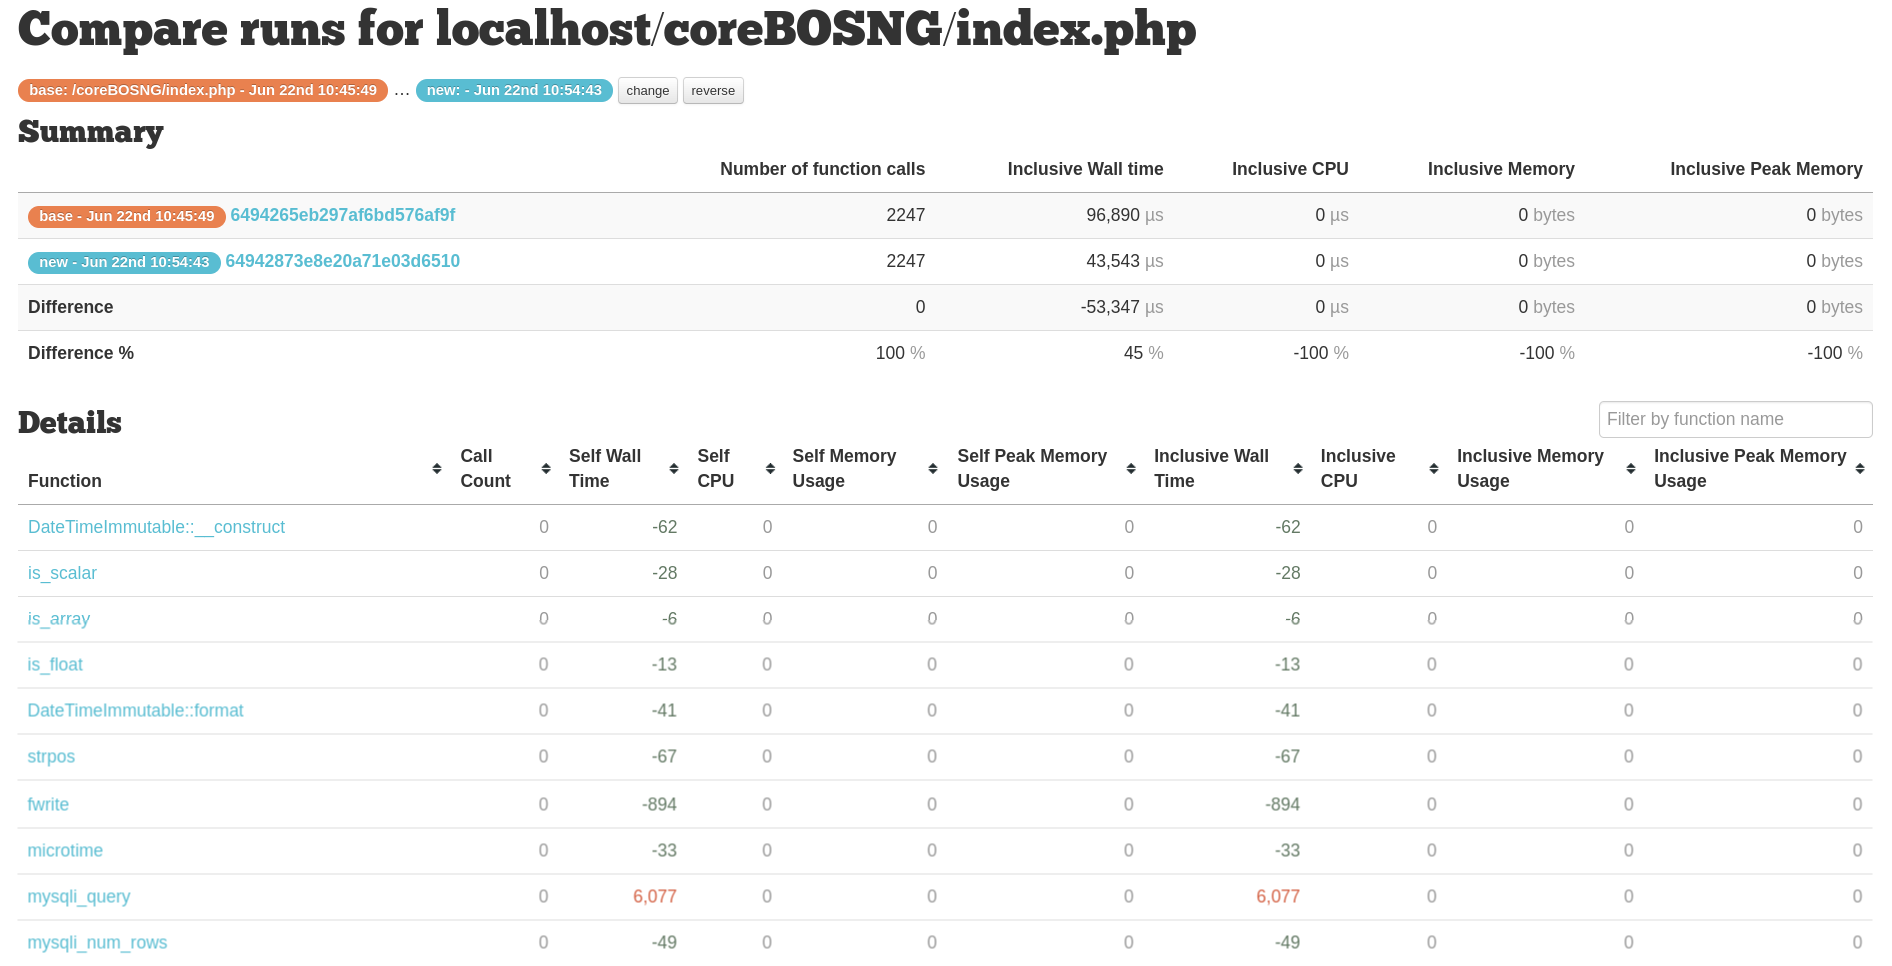
Red values are higher in 'new'. Green values are lower in 'new'.
Waterfall Display
The goal of XHGui's waterfall display is to recognize that concurrent requests can affect each other. Concurrent database requests, CPU-intensive activities, and even locks on session files can become relevant. With an Ajax-heavy application, understanding the page build is far more complex than a single load: hopefully, the waterfall can help.
This feature is important when analyzing live data from production installs where many users are executing the same code in parallel. It will segregate the information by IP and run to make it easier to understand each individual user execution.
Closing comments
In the first post of the series, I presented the PHPBench tool. This is where that tool becomes relevant because you can’t know how much you’ve improved until you start to measure your progress, which is why we must benchmark an application before proceeding with any optimizations. It’s also important to have some idea of what a realistic set of numbers should look like otherwise we may find ourselves reaching for unattainable goals. But this is also a circular relation as we need to get some idea of the bottlenecks of the application to understand which sections we need to benchmark and start optimizing.
Lastly, I must comment that we can use XHProf in production to analyze specific business procedures that are slow there. This extension is not intrusive and can be applied in a production install. That said, this should be done by informing the users during a specific time frame, not leaving it there forever. PHP will work faster if XHProf is not installed (marginally, but faster).
The goal of this series is to give you the tools you need to analyze and understand the performance of your code base and a much better insight into how it works.
Now we are ready to start applying these tools to our coreBOS 32M project!
Thanks for reading!