
Profile your PHP code
This is the last phase of the project to evaluate the recommended maximum size of data that we can manage in a coreBOS install before we get into the list of tasks of profiling and performance. This phase constructs the recommended infrastructure to profile the code in search of its bottlenecks.
I have to admit that I was surprised to see how little information is on the internet about this topic. Despite being a predominant language on the internet and a perfectly valid, efficient, and incredible language, PHP has no hype these days 😒.
After reading some old posts and reviewing some GitHub projects I eventually landed on the only open-source option that we have: XHProf and XHGUI
XHProf is an official PHP extension that generates tracing measurements for your PHP code. The official definition says it keeps track of call counts and inclusive metrics for arcs in the dynamic callgraph of a program. It computes exclusive metrics in the reporting/post-processing phase, such as wall (elapsed) time, CPU time, and memory usage. A functions profile can be broken down by callers or callees.
XHGUI is a web GUI for the XHProf PHP extension, using a database backend, and pretty graphs to make it easy to use and interpret.
So I started constructing our infrastructure.
XHProf
This part was very easy. XHProf is an official PHP extension so my Linux operating system just had it. I am using the exceptional ppa:ondrej/php repository which not only gives me many different PHP versions but it just has the xhprof extensions available. So all I had to do to get it working was an
apt-get install php8.0-xhprof php8.1-xhprof php8.2-xhprof
restart apache service, and there it is:

Note that there is no output_dir configured, that variable is a default value that is not needed, as we will see next.
Using XHProf
Now we have to see if it is working. Following the official PHP documentation, I create this script.
<?php
xhprof_enable(XHPROF_FLAGS_CPU + XHPROF_FLAGS_MEMORY);

for ($i = 0; $i <= 1000; $i++) {
    $a = $i * $i;
}

$xhprof_data = xhprof_disable();
var_dump($xhprof_data);
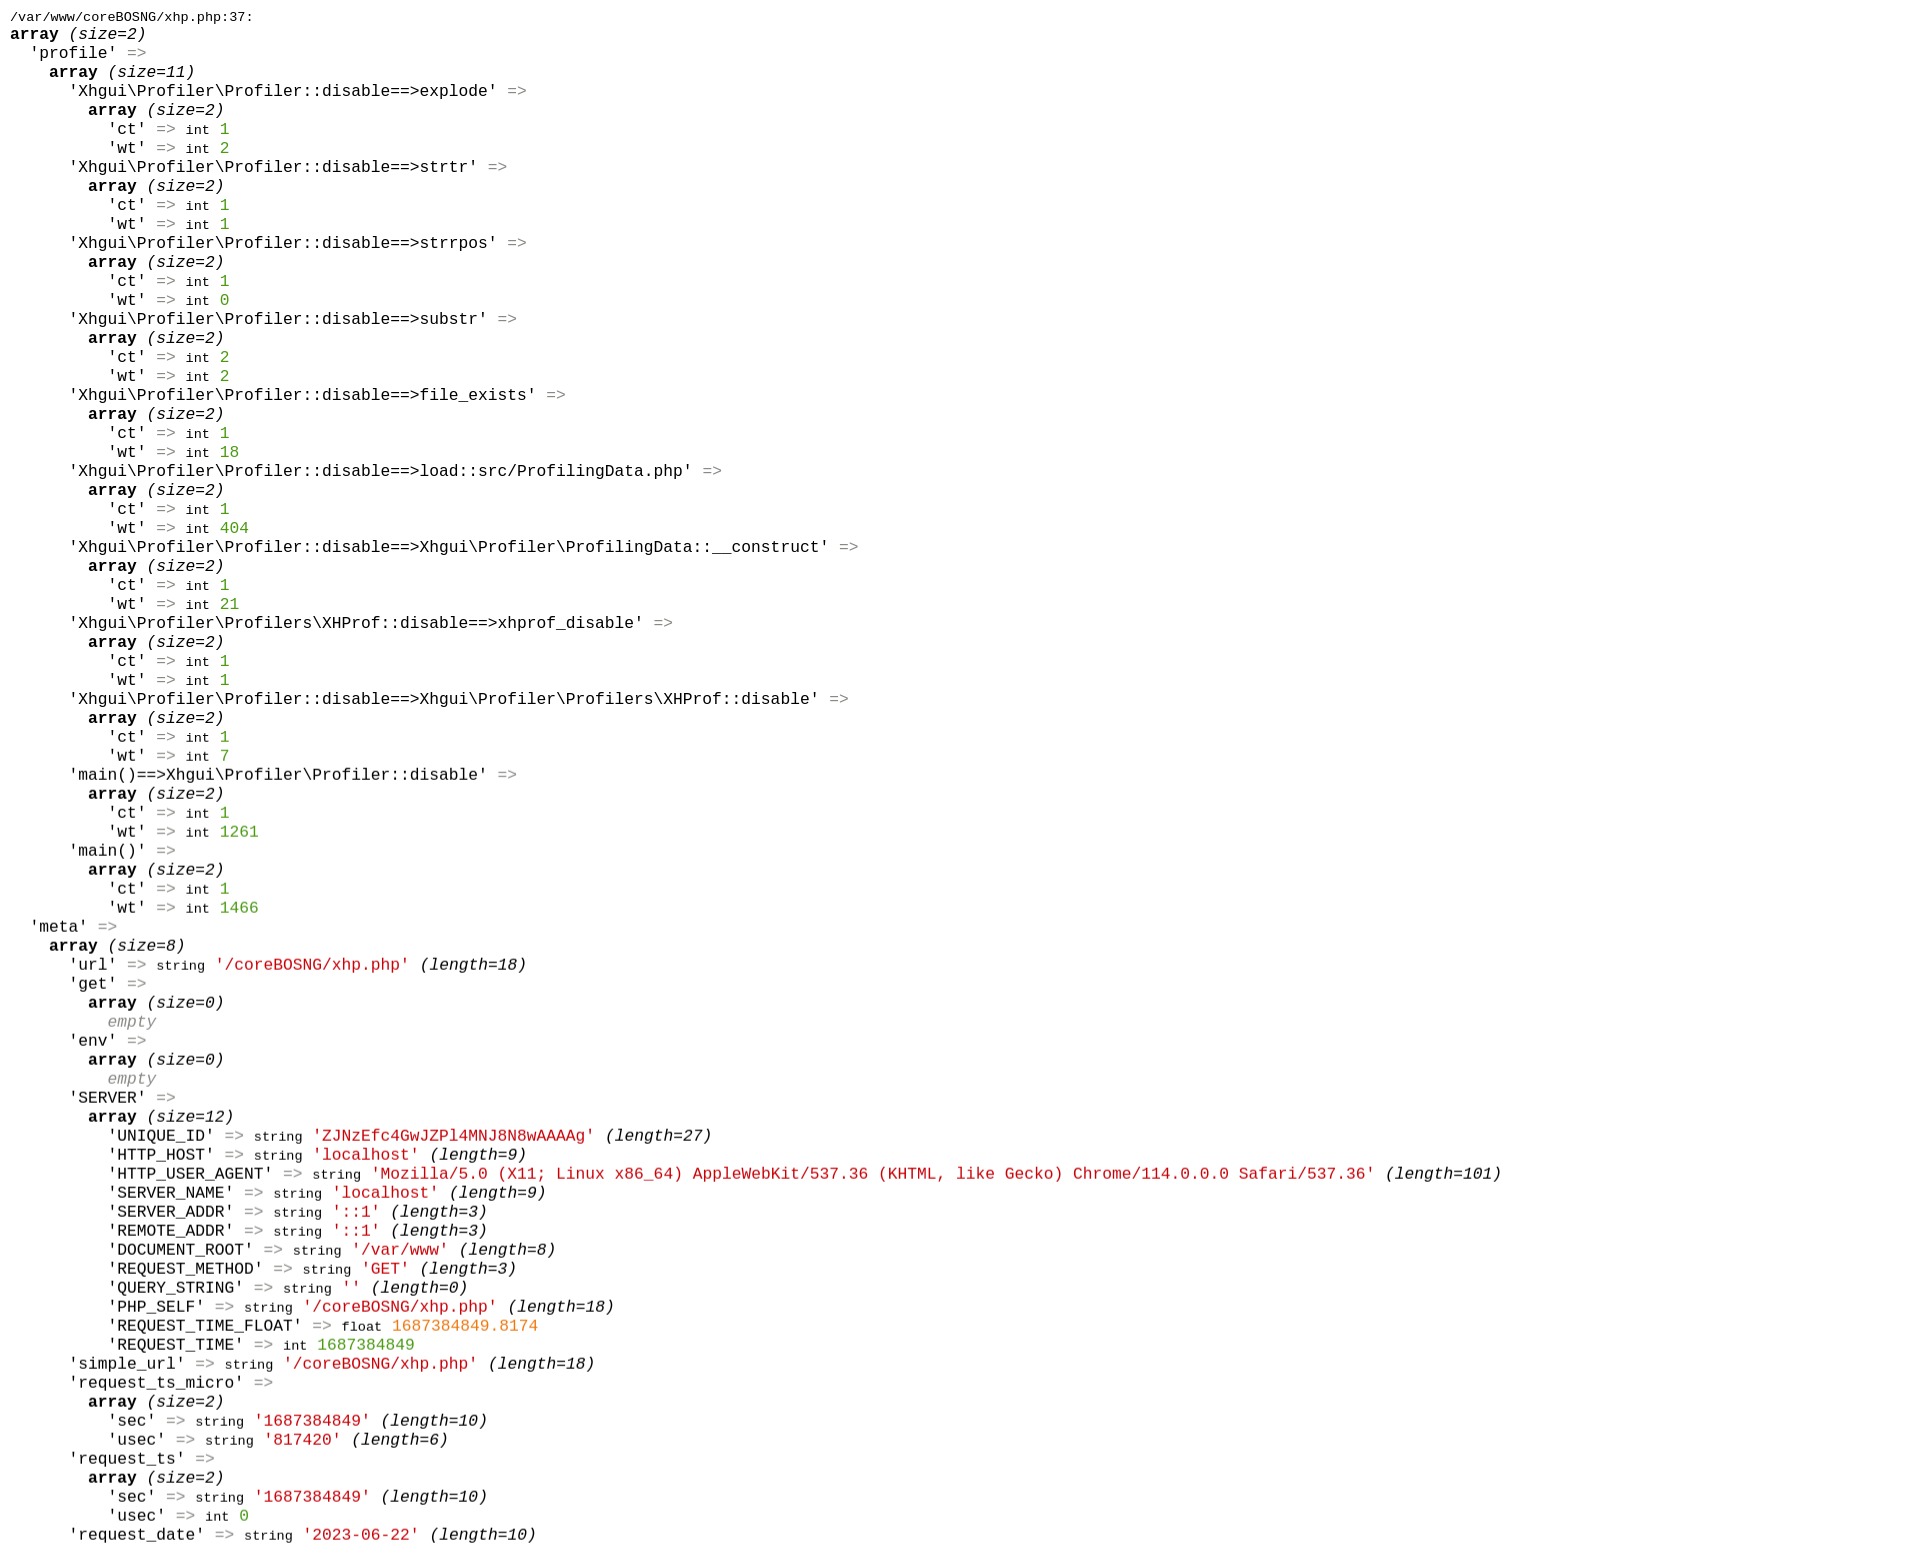
which gives me this output
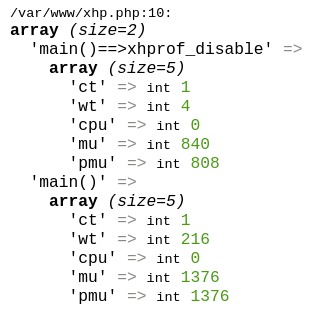
These are the measurements that we need to feed into XHGUI but with some additional meta information. We will see how to do that after starting XHGUI, but if we wanted to save these measurements to be imported later, we could save that data into any directory we want, (which is why we don't care about the xhprof.output_dir) with some code like this
$type = 'xhproftest'; // a category for grouping
$directory = './'; // wherever we want
$file_name = $directory.uniqid().$type.'.xhprof';
$file = fopen($file_name, 'w');
if ($file) {
   fwrite($file, $xhprof_data);
   fclose($file);
}
When activating xhprof in the call above we used the predefined constants XHPROF_FLAGS_CPU and XHPROF_FLAGS_MEMORY. These are:
XHPROF_FLAGS_NO_BUILTINSUsed to skip all built-in (internal) functions.XHPROF_FLAGS_CPUUsed to add CPU profiling information to the output.XHPROF_FLAGS_MEMORYUsed to add memory profiling information to the output.
So you can set any of those as per your requirements.
Now let's see how to visualize that data.
XHGUI
The instructions on the project GitHub page are clear and simple but I decided to try the docker install as it is much easier and cleaner to roll back in case I wasn't convinced. So I cloned the repository and read the docker-compose.yml file to make sure it wasn't going to do anything strange and started it.
The output of the docker-compose command was all correct and I could access the web user interface at http://localhost:8142
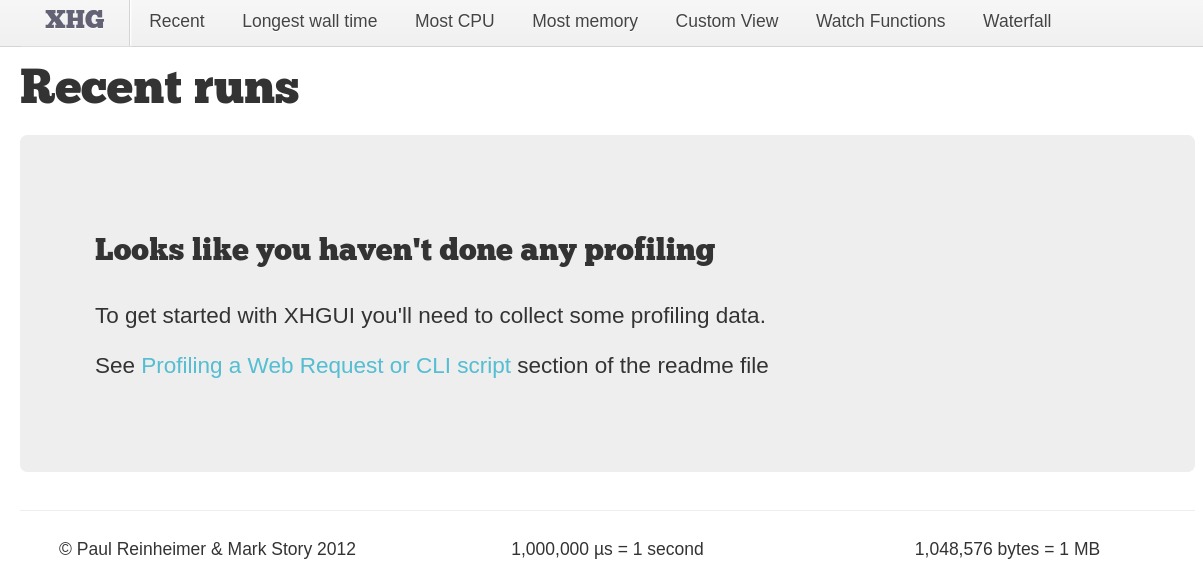
So, that easy, we are ready to start sending the profiling measurements there.
Using PHP Profiler
PHP Profile is a PHP profiling library to submit profilings to XHGui. This library encapsulates the logic described above and gives us some high-level functions to work with profiling. This library does all the heavy lifting for us so we don't have to make calls to the database directly nor have to call the xhprof enable and disable. It gives a nice abstraction to do profiling instead of having to do low-level tasks.
I read the documentation and installed the library with
composer require perftools/php-profiler
Next, I read the configuration file and finally created this code which is equivalent to the first profiling code we had above.
<?php
require_once 'vendor/autoload.php';
use Xhgui\Profiler\Profiler;
use Xhgui\Profiler\ProfilingFlags;

$config = array(
    // This allows to configure, what profiling data to capture
    'profiler.flags' => array(
        ProfilingFlags::CPU,
        ProfilingFlags::MEMORY,
        ProfilingFlags::NO_BUILTINS,
        ProfilingFlags::NO_SPANS,
    ),

    // Saver to use.
    'save.handler' => Profiler::SAVER_UPLOAD,

    'save.handler.upload' => array(
        'url' => 'http://localhost:8142/run/import',
        // The timeout option is in seconds and defaults to 3 if unspecified.
        'timeout' => 3,
        // the token must match 'upload.token' config in XHGui
        'token' => 'token',
    ),
);

$profiler = new Profiler($config);
$profiler->enable([]);

for ($i = 0; $i <= 1000; $i++) {
    $a = $i * $i;
}

$profiler_data = $profiler->disable();
$profiler->save($profiler_data);
var_dump($profiler_data);
Let's go over that.
I load the library and namespaces
I create a configuration array variable.
I set the equivalent flags that we had in our first script
I define where the library should save the measurements (SAVER_UPLOAD). This requires some attention. XHGUI, which we started with docker, supports the endpoint
run/importso we can call that from the PHP Profiler library, but both applications MUST share a secret token. I had to stop the docker-compose and add theXHGUI_UPLOAD_TOKENenvironment variable with the valuetoken
I initialize the profiler library with the configuration
I start and end profiling
I save the data in the XHGUI import endpoint which ends up in the MongoDB database
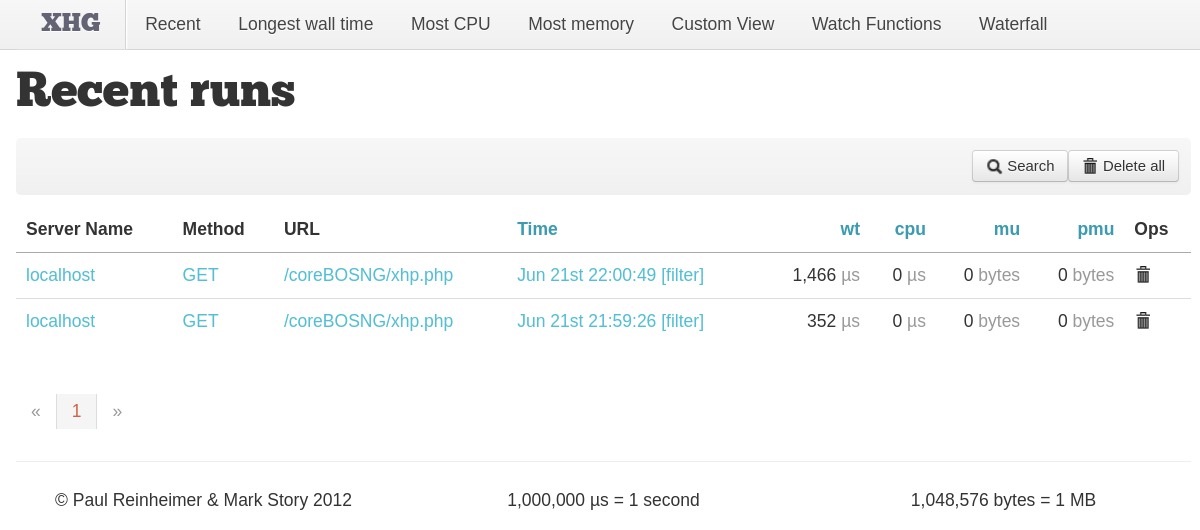
I dump the data and see that it is richer than the first test we did
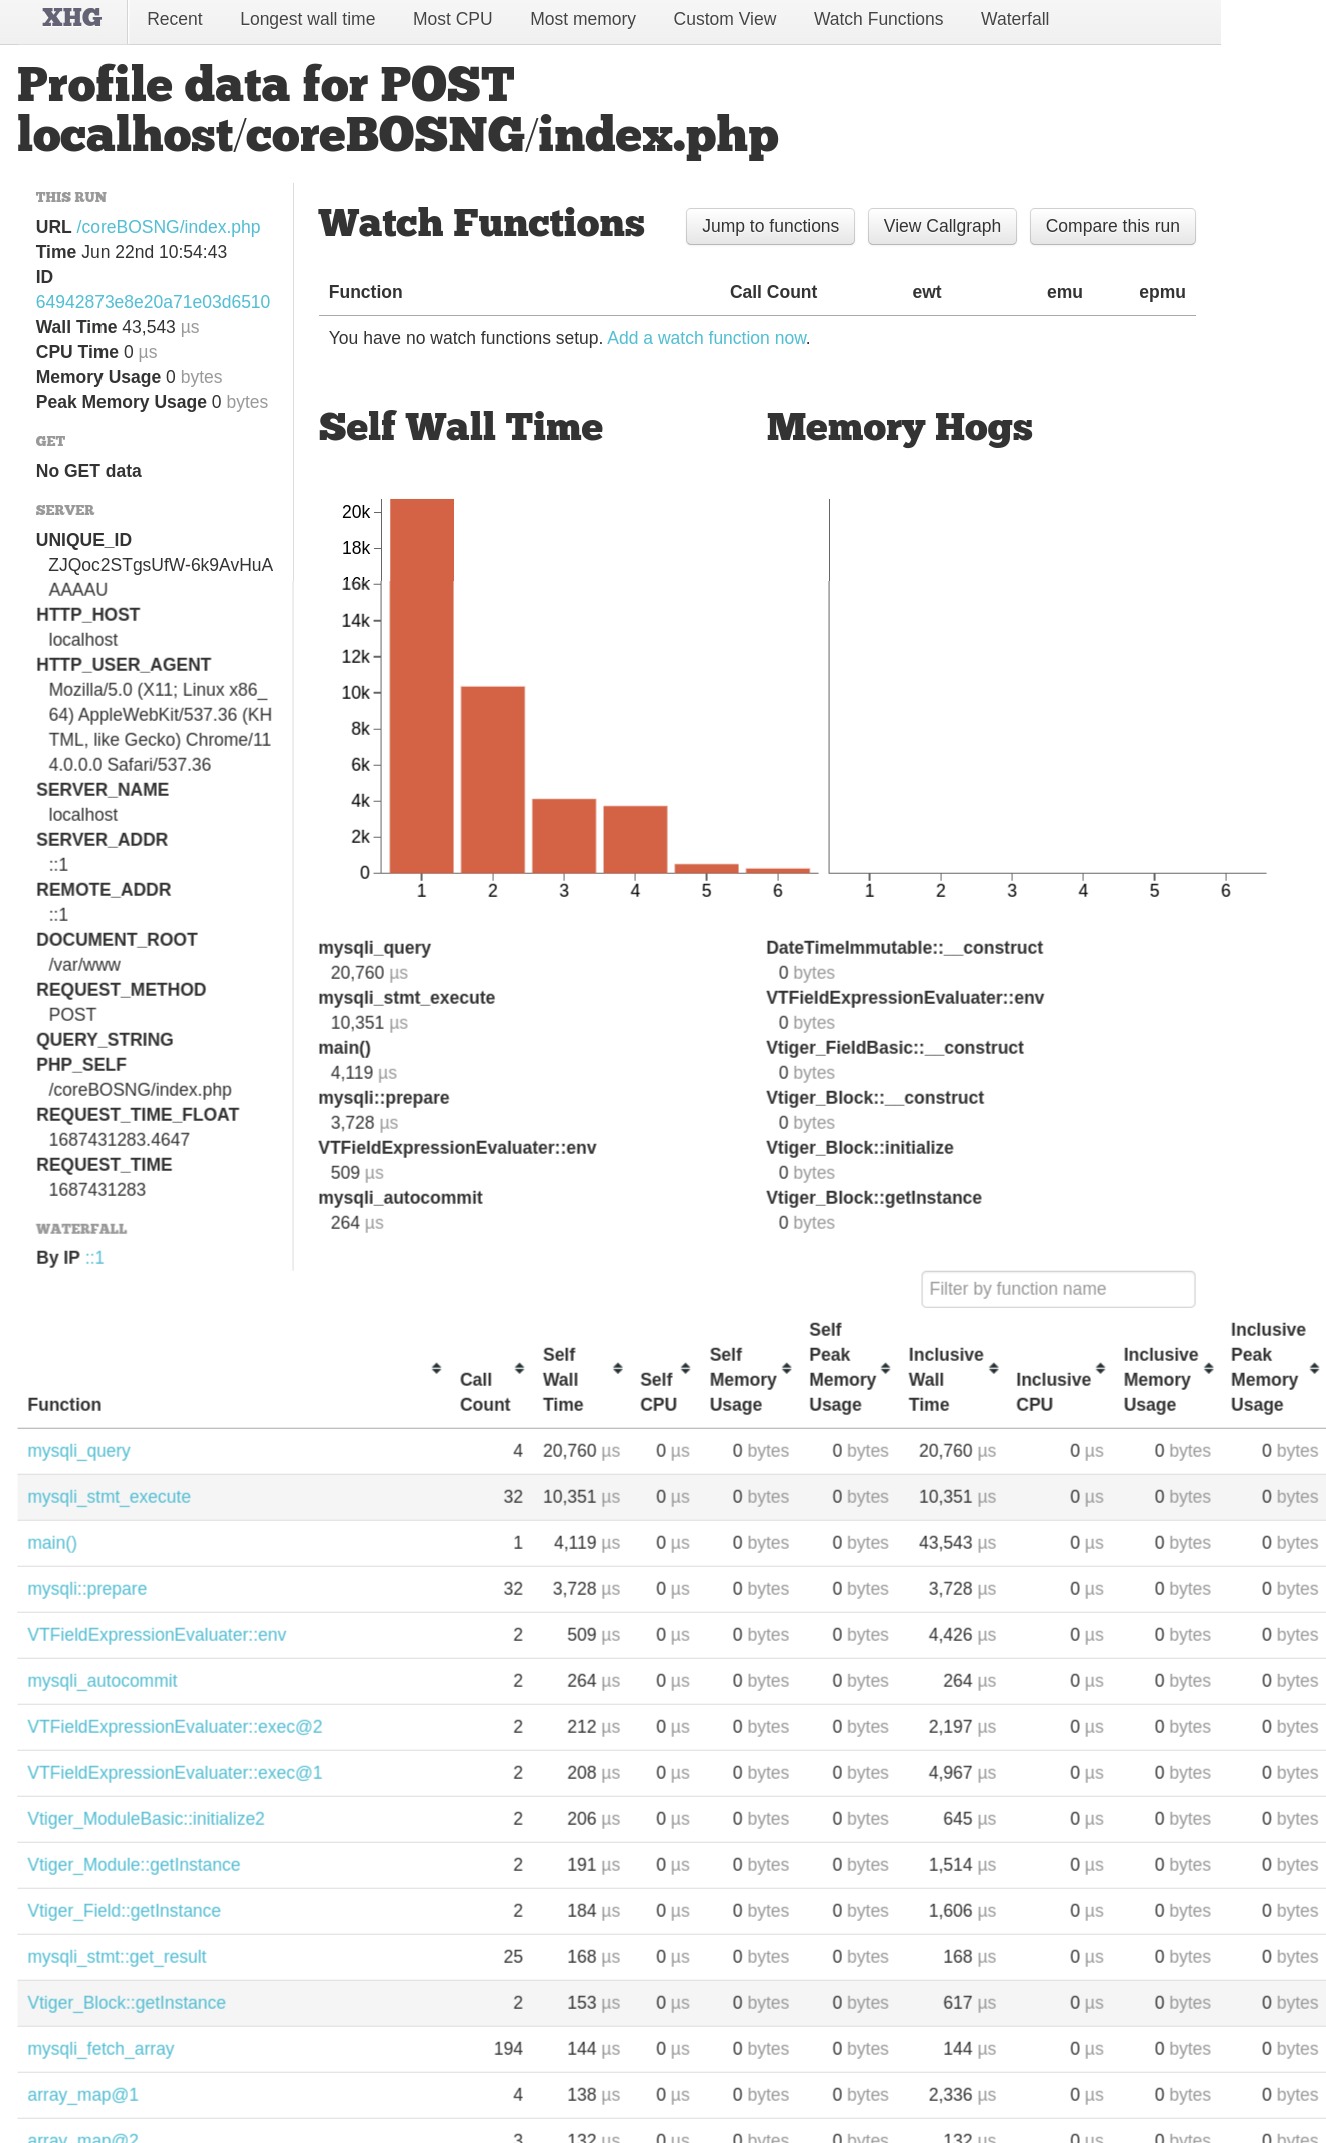
I run that twice and reload the XHGUI web interface:
This is the change I made in the docker-compose file
diff --git a/docker-compose.yml b/docker-compose.yml
index e5efbd6..3132828 100644
--- a/docker-compose.yml
+++ b/docker-compose.yml
@@ -11,6 +11,7 @@ services:
     environment:
       - XHGUI_MONGO_HOSTNAME=mongo
       - XHGUI_MONGO_DATABASE=xhprof
+      - XHGUI_UPLOAD_TOKEN=token
     ports:
       - "8142:80"
Convinced!
coreBOS
With this knowledge, adding profiling to coreBOS is simple.
I use composer to add the PHP Profile library.
I create a script to load the configuration and the object in
build/ProfilerConfig.phpwhich looks like this
<?php
require_once 'vendor/autoload.php';
use Xhgui\Profiler\Profiler;
use Xhgui\Profiler\ProfilingFlags;

$ProfileConfig = array(
    // This allows to configure, what profiling data to capture
    'profiler.flags' => array(
        ProfilingFlags::CPU,
        ProfilingFlags::MEMORY,
        ProfilingFlags::NO_BUILTINS,
        ProfilingFlags::NO_SPANS,
    ),

    // Saver to use.
    'save.handler' => \Xhgui\Profiler\Profiler::SAVER_UPLOAD,

    'save.handler.upload' => array(
        'url' => 'http://localhost:8142/run/import',
        // The timeout option is in seconds and defaults to 3 if unspecified.
        'timeout' => 3,
        // the token must match 'upload.token' config in XHGui
        'token' => 'token',
    ),
);
$profiler = new Profiler($ProfileConfig);
Obviously, you have to set the configuration to your environment.
Now we can include this script and profile any code we need with just three lines of code. I tested that with the workflow Update task. I added the three lines to the modules/com_vtiger_workflow/tasks/VTUpdateFieldsTask.inc script; two at the start of the doTask() method, to include the script above and start profiling, and the last line at the end of the method to stop profiling and save.
diff --git a/modules/com_vtiger_workflow/tasks/VTUpdateFieldsTask.inc b/modules/com_vtiger_workflow/tasks/VTUpdateFieldsTask.inc
index ed6a16e54..bdb30a59d 100644
--- a/modules/com_vtiger_workflow/tasks/VTUpdateFieldsTask.inc
+++ b/modules/com_vtiger_workflow/tasks/VTUpdateFieldsTask.inc
@@ -29,6 +29,8 @@ class VTUpdateFieldsTask extends VTTask {

        public function doTask(&$entity) {
                global $adb, $current_user, $logbg, $from_wf, $currentModule;
+               include 'build/ProfileConfig.php';
+               $profiler->enable([]);
                $logbg->debug('> UpdateFieldsTask');
                $from_wf = true;
                $util = new VTWorkflowUtils();
@@ -183,6 +185,7 @@ class VTUpdateFieldsTask extends VTTask {
                $util->revertUser();
                $from_wf = false;
                $logbg->debug('< UpdateFieldsTask');
+               $profiler->save($profiler->disable());
        }
 }
 ?>
So we have to include the profiling configuration and start profiling before the code we want to measure and stop profiling and save after it:
// ...
include 'build/ProfileConfig.php';
$profiler->enable([]);
// code we want to measure
$profiler->save($profiler->disable());
// ...
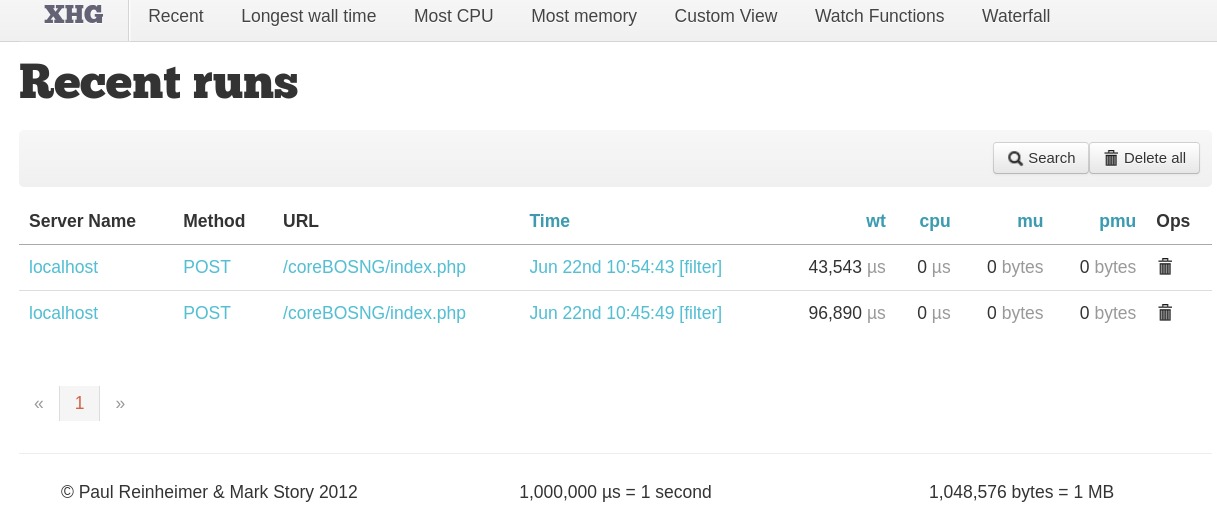
Now we are ready to start measuring the performance of coreBOS
Summary
I understand better now why there isn't much information out there, it is really easy to get this working and there aren't any other options except the paid ones
we need three tools working together to do profiling: XHProf, PHP Profile, and XHGUI
getting them to work together is relatively easy
I will do another post explaining how to use the XHGUI information we are saving
Thanks for reading.